

Stock News Highlights
TVS Motor (+5.62%): Shares surged after the company reported a 65% YoY jump in consolidated Q1 FY27 net profit to ₹1,058 crore, with revenue rising 33% to ₹16,296 crore, driven by record quarterly sales and strong EV demand.
Premier Energies (-3.50%): Shares fell after the government extended the deadline for mandatory domestic solar cell sourcing to December 31, 2026, easing supply constraints but delaying demand for locally manufactured solar cells.
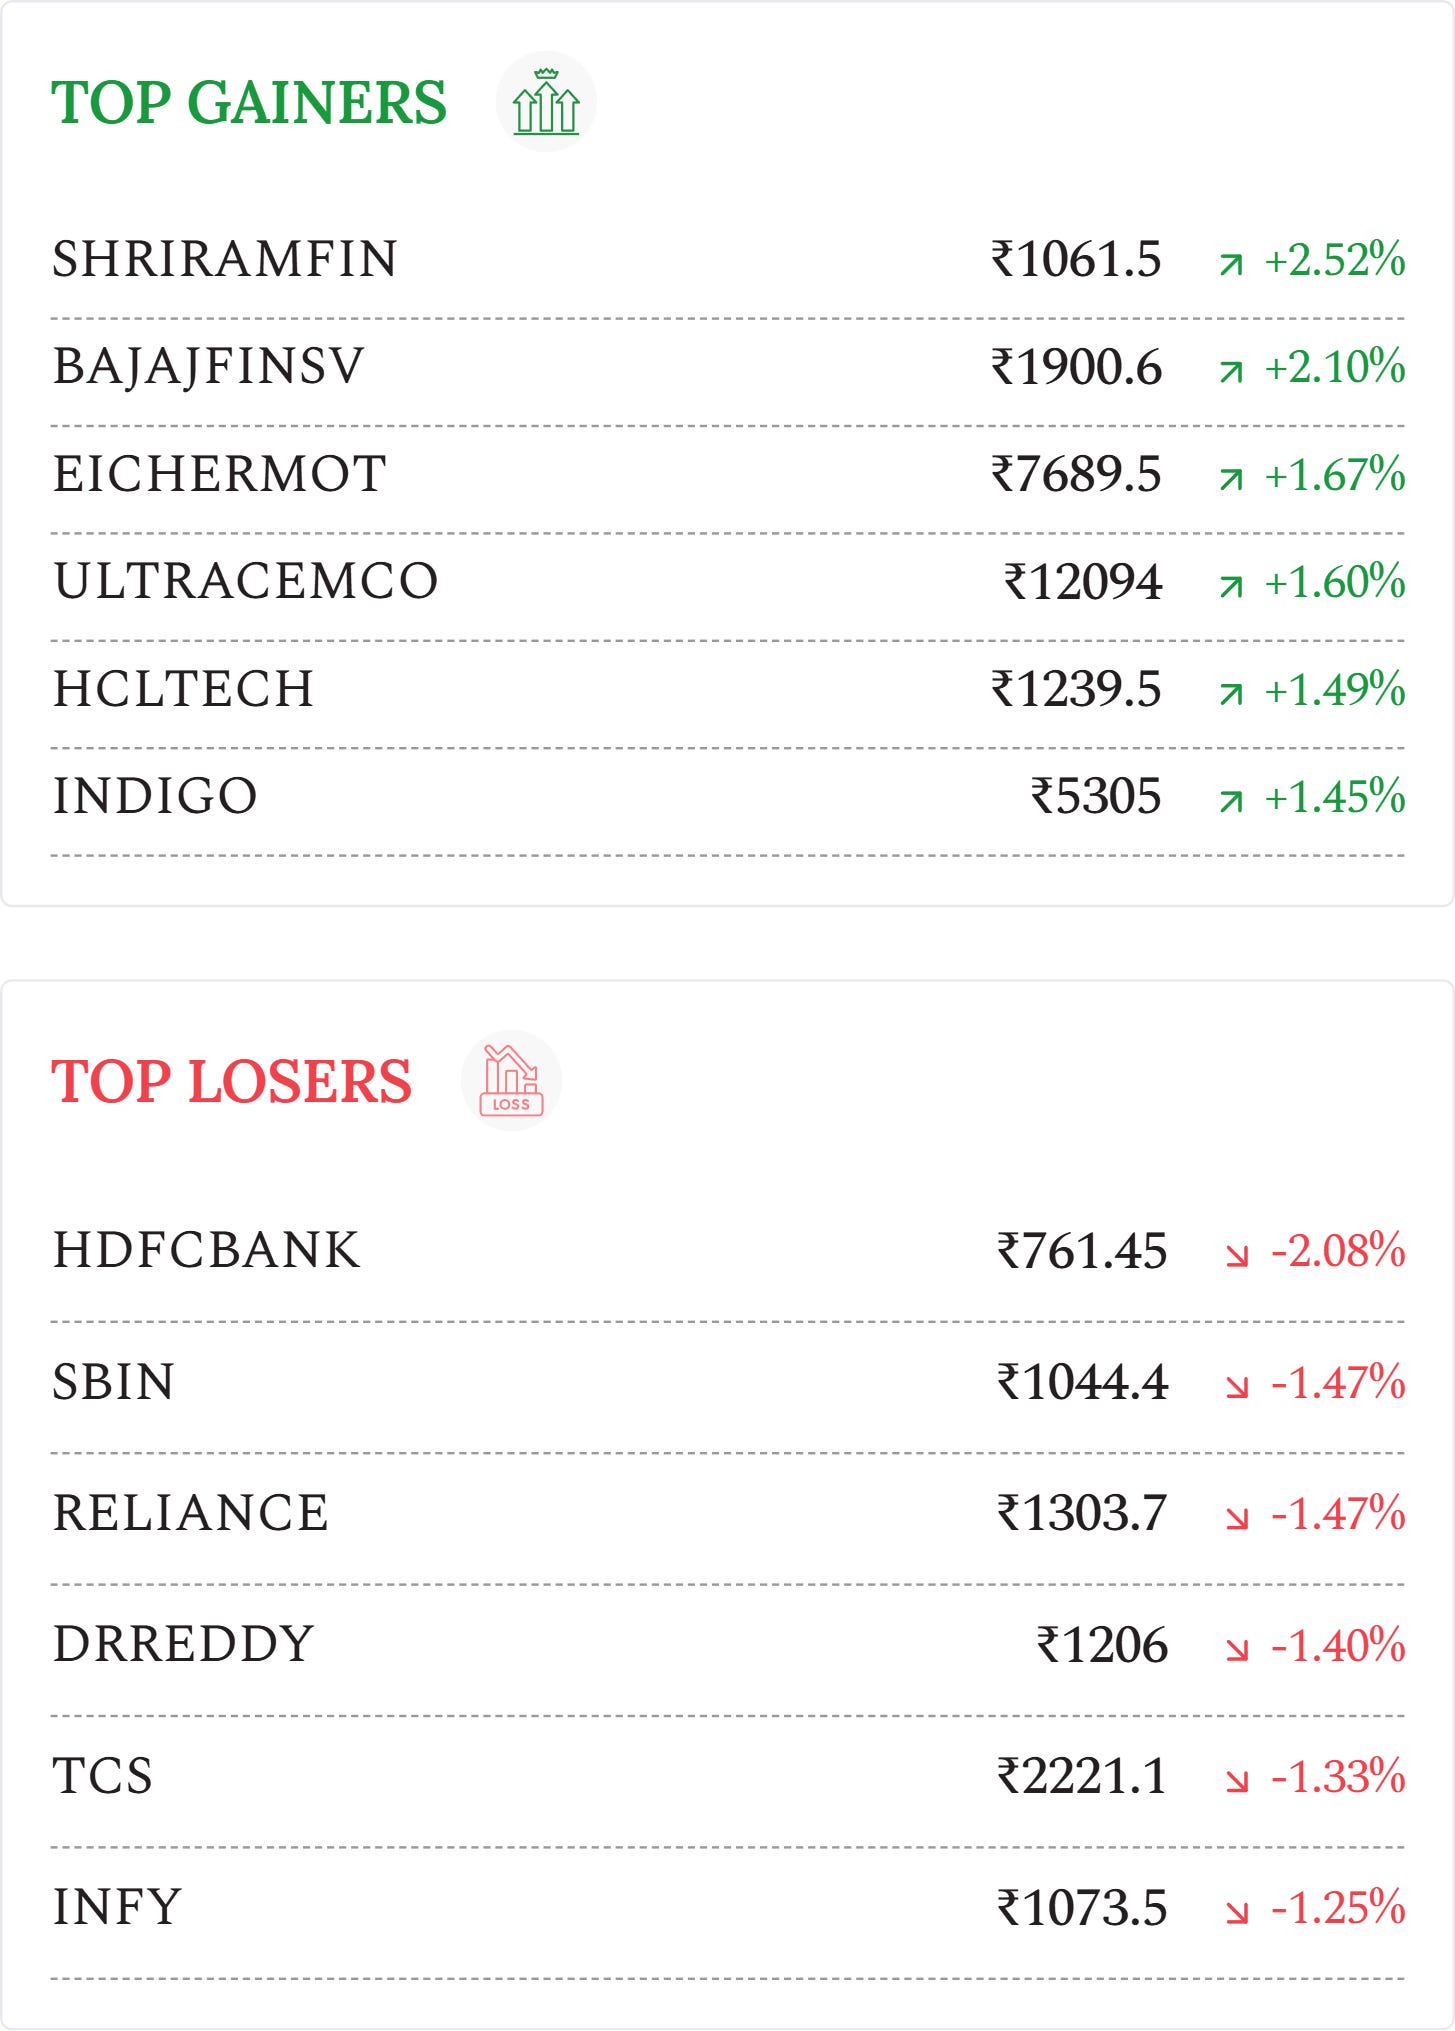
InterGlobe Aviation (+1.45%): Shares gained after DGCA data showed IndiGo strengthened its domestic market leadership in June with a 66.3% market share, carrying 89.2 lakh passengers, reinforcing its dominant position in India’s aviation sector.
Mahindra & Mahindra Financial Services (+8.46%): Shares surged after the NBFC reported a 75.3% YoY jump in Q1 FY27 net profit to ₹927.5 crore, while net interest income rose 18% to ₹2,580 crore, supported by strong loan growth and improving asset quality.
Sectoral Performance
Nifty Realty (+1.07%): The index extended its three-day winning streak as sustained buying interest lifted real estate stocks. Gains were led by Prestige Estates, Godrej Properties, and DLF, with improving sector sentiment supporting the rally. Over the last month, the index has surged nearly 14%, reflecting strong investor confidence in the sector.
Nifty Auto (+0.93%): The index ended higher with 9 gainers and 6 losers as investors remained focused on Q1 FY27 earnings. Key results from Bajaj Auto and TVS Motor Company are expected to drive near-term momentum in the auto sector.
Nifty PSU Bank (-0.88%): The index slipped after the previous session’s sharp rally as investors booked profits with 5 gainers and 5 losers. Weakness in heavyweight constituents offset gains in select PSU lenders, leading to a broadly subdued session.
Nifty IT (-0.61%): The index declined as weak revenue guidance from global technology companies, cautious corporate IT spending, and elevated valuations weighed on sentiment. Selling in heavyweights such as TCS, Infosys and Coforge dragged the sector lower.
Market Insights
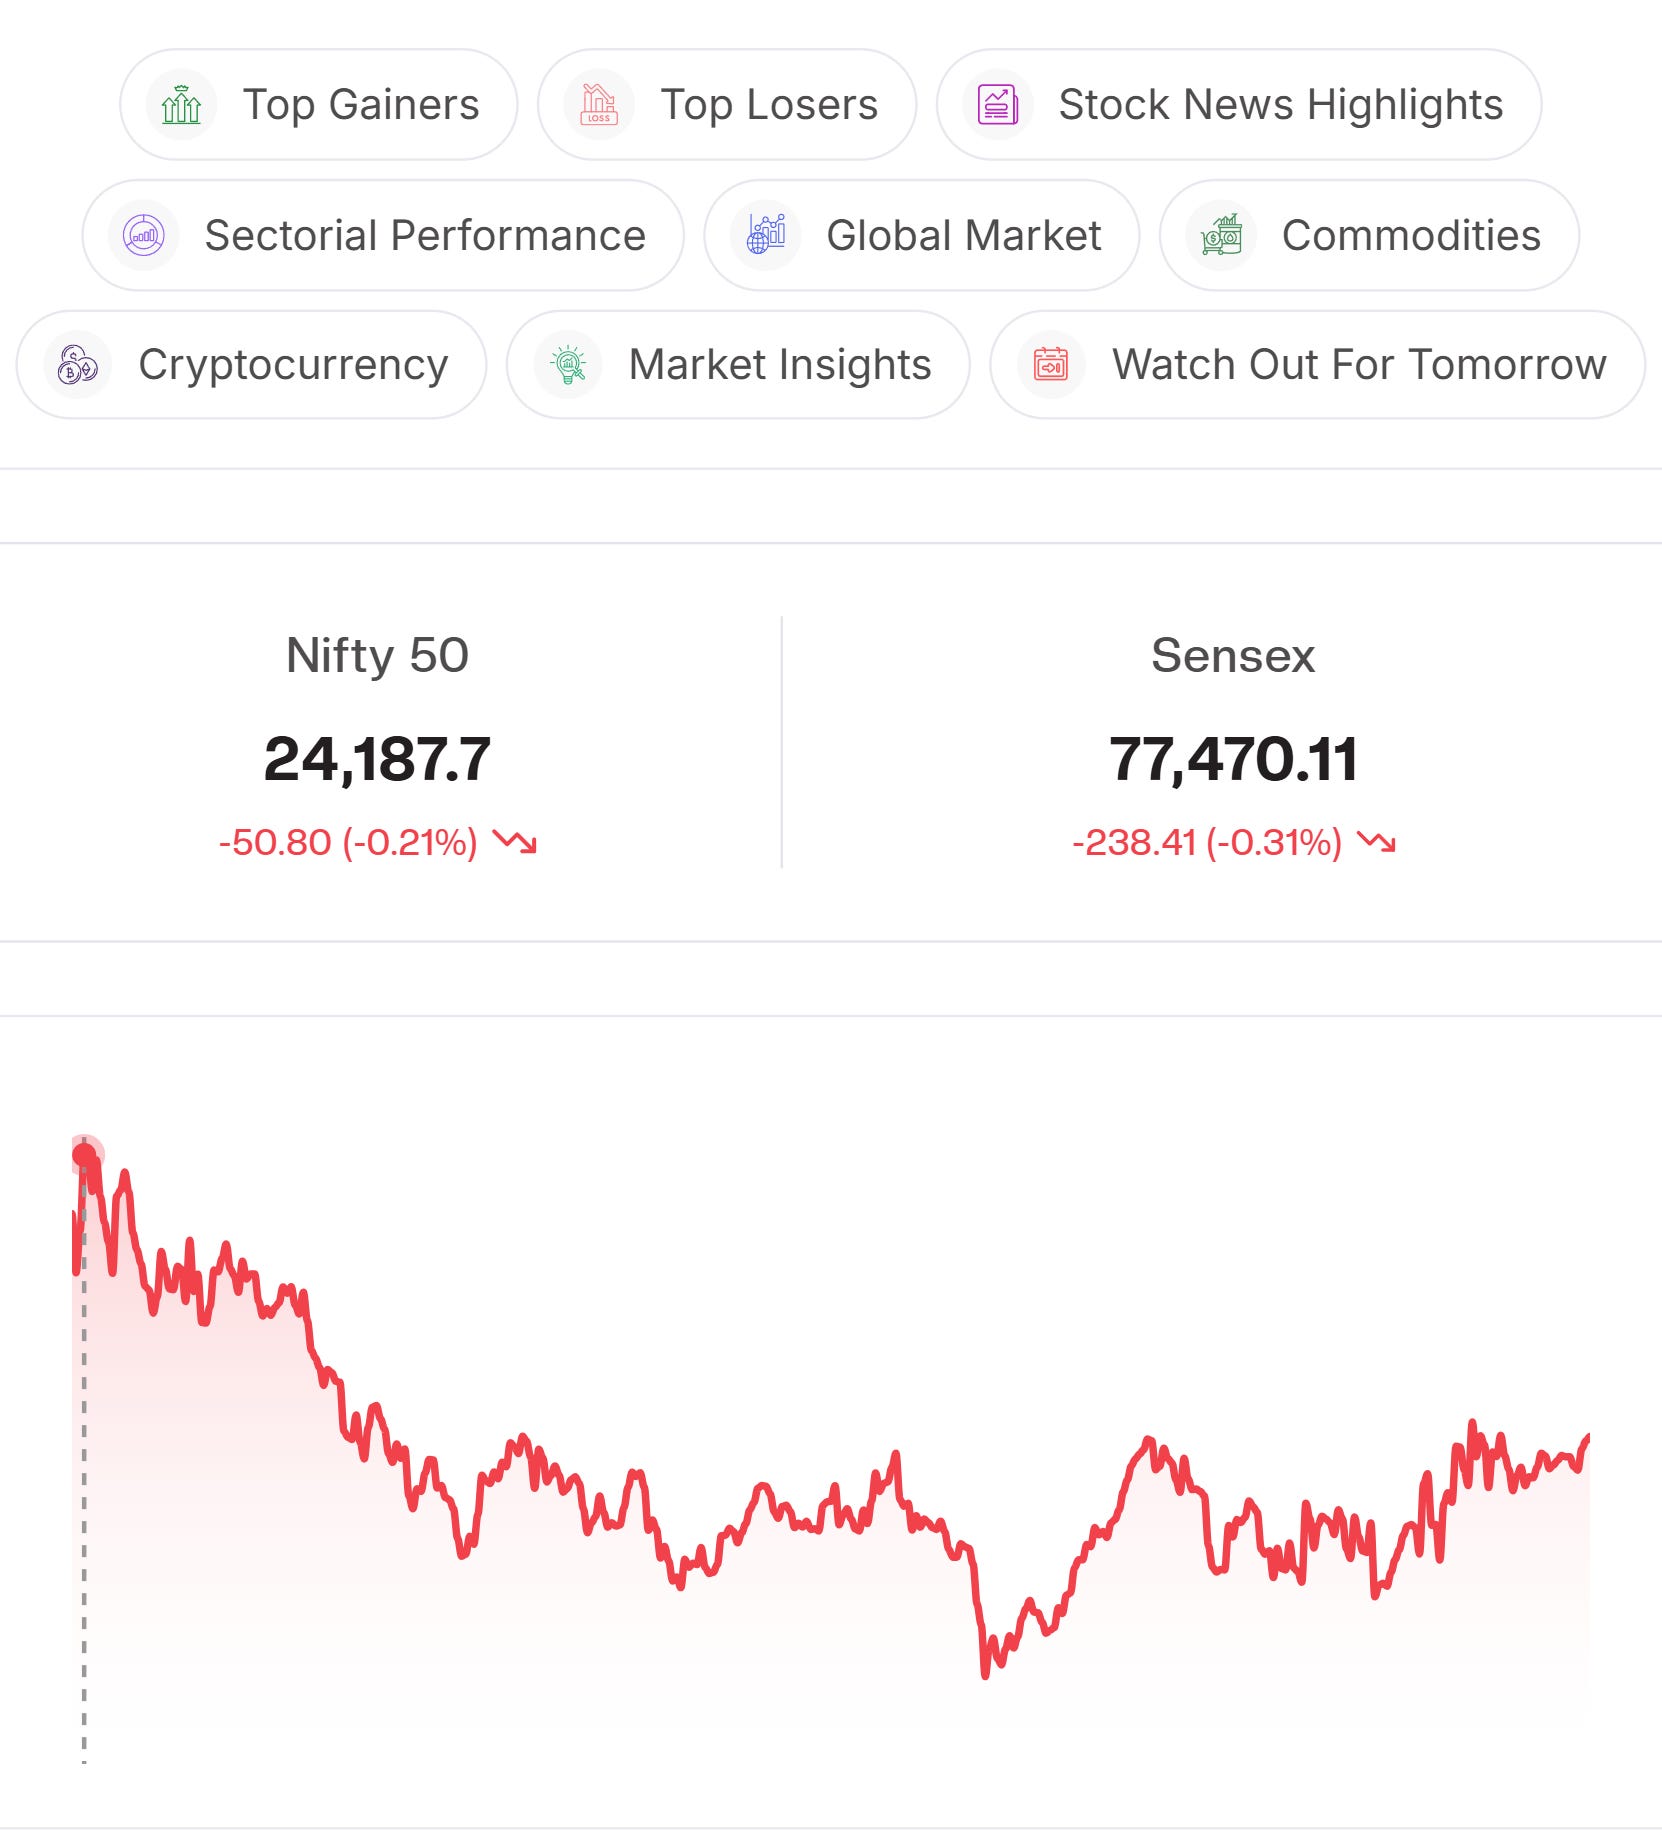
Technical Level: Nifty opened with a minor gap-down but recovered immediately, finding resistance near the previous session’s close around 24,260. Selling pressure intensified thereafter, dragging the index lower throughout the session. It found support near 24,130 and traded around that level until the close, ending the day in negative territory.
Advance-Decline Ratio: Market breadth remained positive, with 1,810 stocks advancing against 1,504 declining, indicating broader buying interest despite weakness in the benchmark indices.
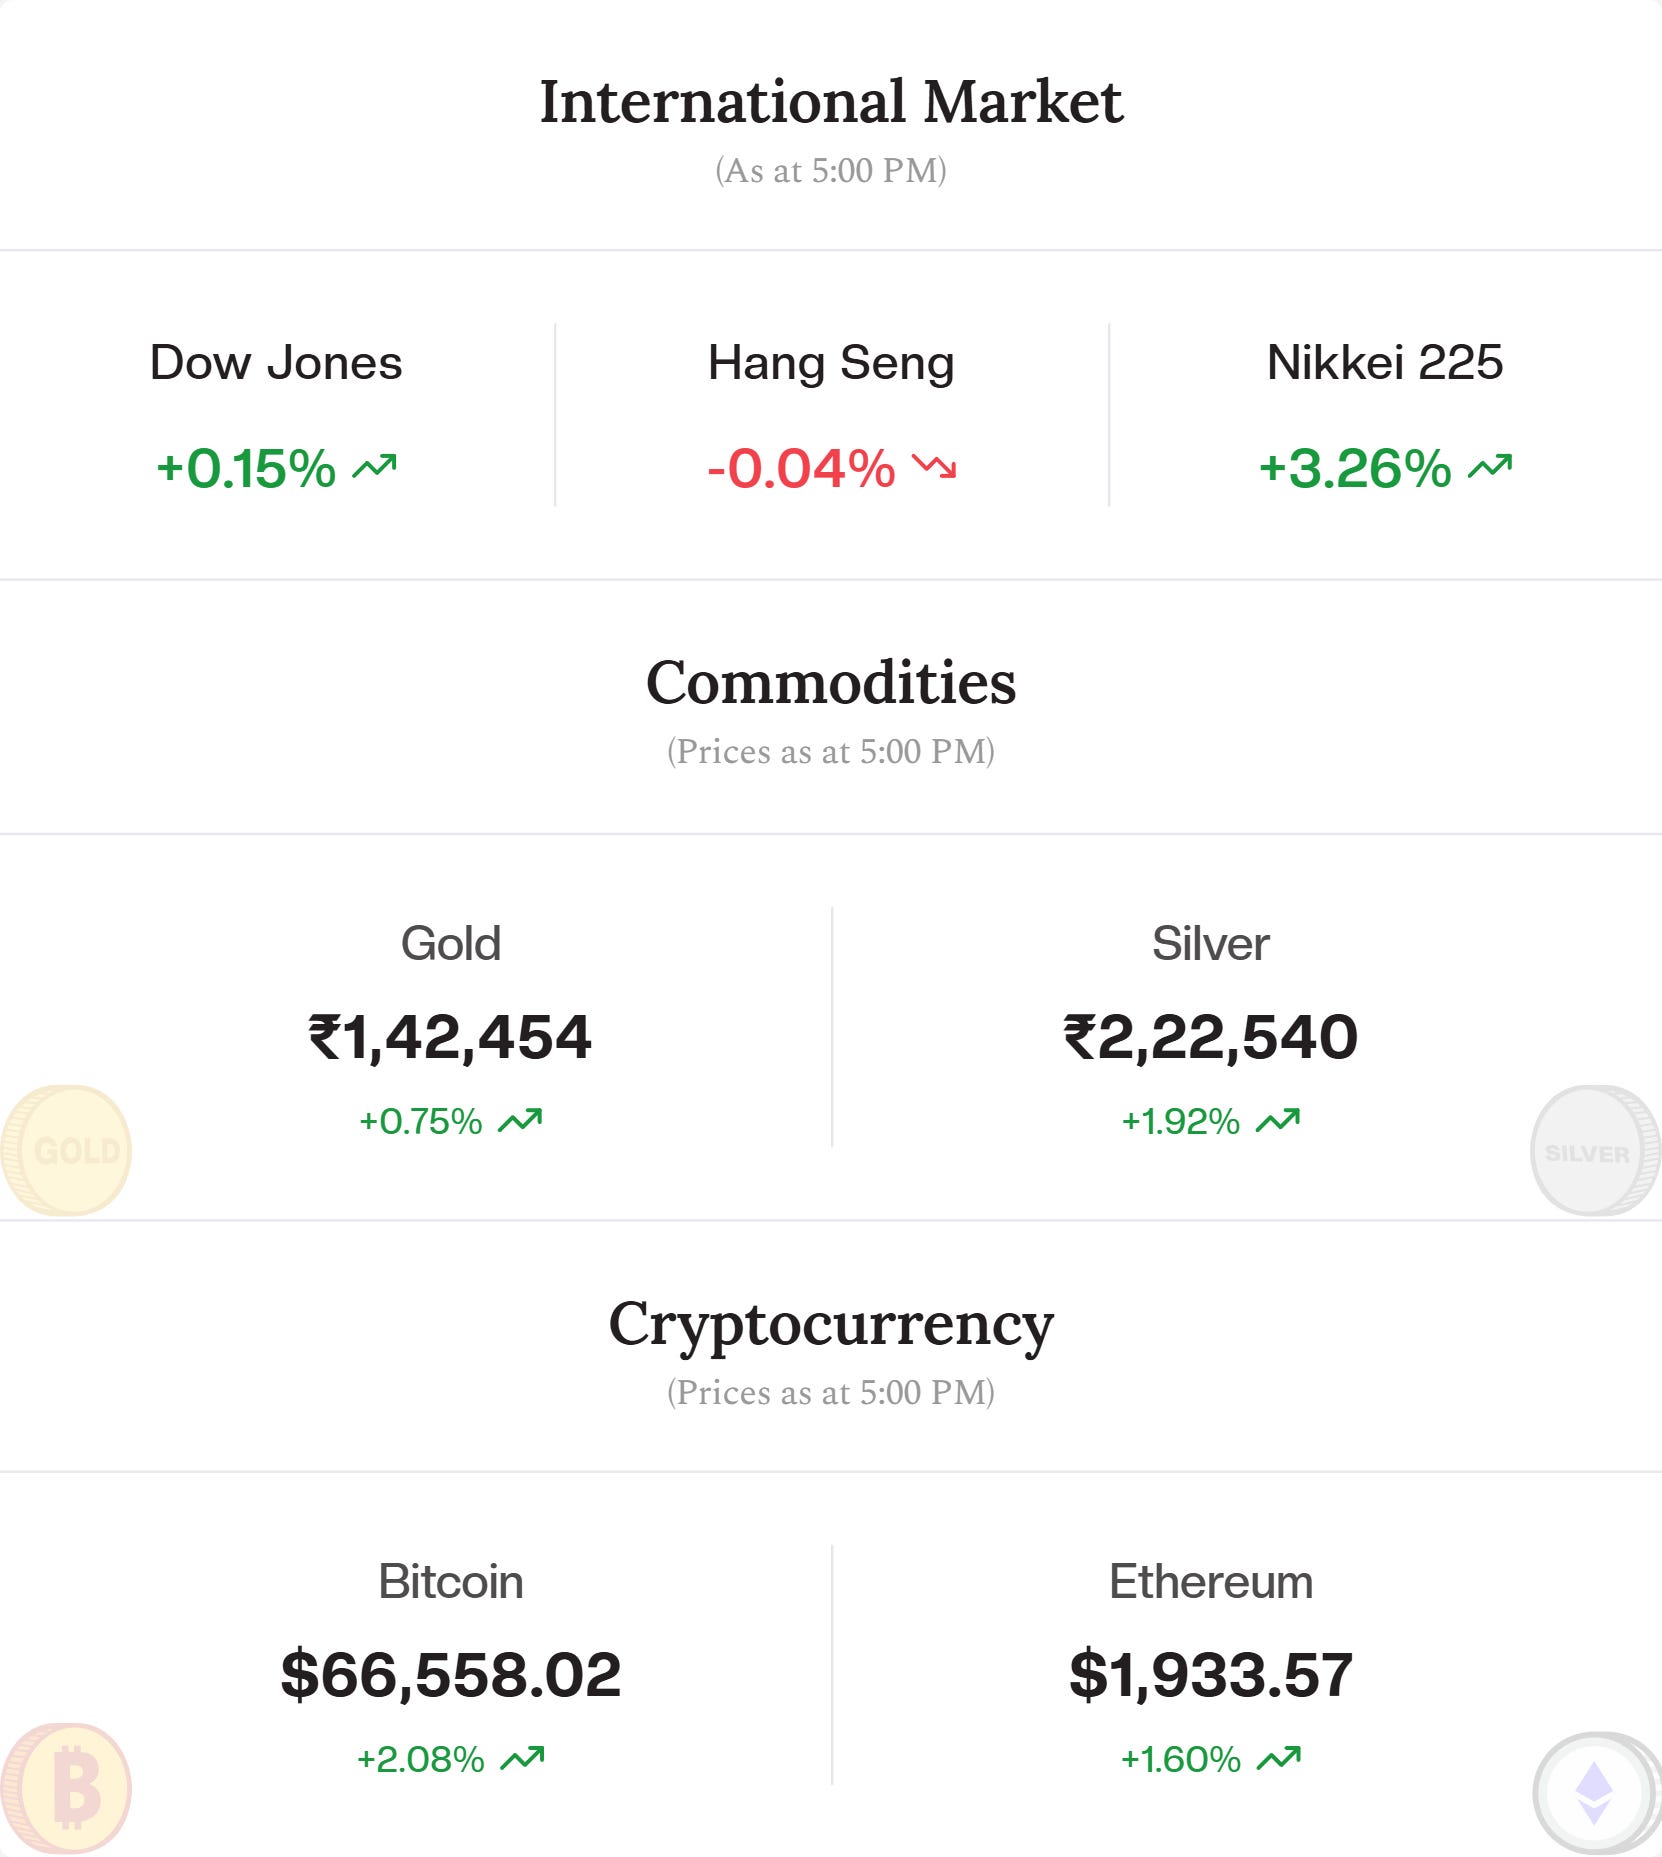
The Big Picture: Asian markets ended mostly lower after a sharp sell-off in global technology stocks, triggered by weakness in AI-linked semiconductor shares on Wall Street. Rising geopolitical tensions in the Middle East also kept investors cautious, while elevated crude oil prices added to concerns over inflation and global economic growth.
FII/DII Activity (July 20, 2026): FIIs remained net sellers with outflows of ₹1,121 crore, while DIIs continued to provide support, remaining net buyers with inflows of ₹1,312 crore.
Watch Out For Tomorrow
IPO Corner: Caliber Mining & Logistics IPO Closing for subscription Tomorrow, making the key primary market offerings with good GMP.
Macro: UK Unemployment Rate (May) data scheduled for release tomorrow.
Market Watch: Tuesday’s session was shaped by Q1 earnings, weekly expiry, and rising geopolitical tensions. Strong quarterly results from TVS Motor and Bajaj Auto supported the auto sector, but expiry-led selling kept the Nifty under pressure. Global sentiment remained cautious after fresh US strikes on Iran, while higher crude oil prices weighed on risk appetite. Premier Energies and Waaree Energies fell after the government extended the domestic solar cell sourcing deadline, delaying near-term demand expectations.
Word of the day
RSI (Relative Strength Index)
Meaning: RSI is a momentum indicator that measures the speed and magnitude of a stock’s recent price movements on a scale of 0 to 100. It helps traders identify whether a stock is overbought or oversold.
Example: An RSI above 70 may indicate the stock is overbought and could face selling pressure, while an RSI below 30 may suggest it is oversold and could see a potential rebound.