


Indian markets endured a sharp sell-off this week, despite several companies reporting strong Q2 FY27 earnings. For the week ended October 23, 2026, the Nifty 50 fell 2.36% to 22,600, while the Sensex declined 2.15% to 73,123.83. The broader market suffered even heavier losses, with the Nifty Midcap 150 dropping 5.6% and the Nifty Smallcap 250 plunging 7.3%.
So, why are stocks falling despite strong earnings? Rising crude oil prices above $116 per barrel, FII selling, elevated US bond yields and geopolitical tensions have weighed on investor sentiment.
In this edition of Paper by Pocketful, we explore the earnings trends, global risks and key market levels that could shape the week ahead.
The Week in Markets: Selling Spreads Beyond the Benchmarks
Indian equities extended their decline for a fourth consecutive session on October 23. The Nifty 50 ended at 22,600, while the Sensex settled at 73,123.83. Both indices recorded weekly losses of more than 2%.

The difference between benchmark and broader-market performance was striking. While the headline indices recorded moderate declines, mid-cap and small-cap stocks suffered much heavier losses.
On October 23, 624 stocks advanced against 3,011 declines, reflecting a sharply negative market breadth. Metals, real estate and PSU banking were among the weakest areas during the session.
The takeaway? The correction was not limited to a handful of heavyweight stocks. Investors were reducing exposure across several segments, particularly smaller companies that are more vulnerable when liquidity tightens and risk appetite weakens.
Q2 FY27 Earnings: Strong Numbers, Weak Stock Reactions
The September-quarter earnings season has produced several impressive profit-growth figures. Yet, some companies have seen their share prices decline despite reporting higher revenue and profits.
Companies delivering strong results
Adani Power: Revenue rose 44% year-on-year to ₹19,439 crore, while net profit surged 141% to ₹7,022 crore. Despite the strong performance, the stock declined 1.74% on October 23.
JSW Steel: Revenue increased 20% to ₹54,486 crore, while net profit jumped 192% to ₹5,067 crore. However, shares fell 2.83% during the session, reflecting the broader pressure on metal stocks.
Shriram Finance: Revenue grew 15% to ₹13,792 crore, while net profit increased 59% to ₹3,667 crore. The stock nevertheless declined 3.98%.
CG Power: Revenue climbed 30% to ₹3,802 crore, and net profit rose 44% to ₹409 crore. Shares slipped 0.46%.
Jindal Steel: Revenue increased 42% to ₹16,679 crore, while net profit grew 21% to ₹771 crore. Its shares fell 2.03%.
These examples show why investors should distinguish between a company’s financial performance and the broader market environment. Strong earnings may support long-term business prospects, but they cannot always overcome sector-wide selling or concerns about future growth.
Where the results were more mixed
Not every company reported growth across all key metrics.
Infosys: Revenue increased 10% to ₹49,244 crore, while net profit rose 6% to ₹7,938 crore. The company also lowered its FY27 revenue growth guidance, reinforcing concerns about future growth visibility.
Torrent Pharma: Revenue jumped 50% to ₹4,979 crore, but net profit declined 9% to ₹534 crore.
BPCL: Revenue increased 42% to ₹1,49,080 crore, while net profit fell 19% to ₹4,538 crore.
Tata Motors: Revenue grew 36% to ₹25,338 crore, while the company moved from a net loss of ₹855 crore to a profit of ₹1,211 crore.
These results underline why headline revenue growth alone is insufficient. Investors must also examine margins, exceptional items, operating costs, cash flows and management guidance.
Note: Figures are consolidated and based on the Q2 FY27 results snapshot provided. Share-price changes refer to October 23, 2026.
Crude Oil Shock: Why India Is Particularly Vulnerable
Crude oil became one of the biggest sources of uncertainty for Indian equities this week. Brent crude surged above $114 per barrel amid escalating geopolitical tensions and concerns about disruptions to Saudi Arabian oil supplies.
For India, a major crude oil importer, higher prices can create several challenges simultaneously.
First, inflationary pressure increases. Expensive energy raises transportation, manufacturing and logistics costs. If these costs pass through to consumers, household purchasing power may weaken.
Second, corporate margins can come under pressure. Aviation, paints, chemicals, automobiles and logistics companies are particularly sensitive to fuel and input costs. Companies may struggle to pass on the entire increase to customers.
Third, the external balance and rupee face additional pressure. A higher oil import bill can widen the current account deficit and increase demand for dollars.
Higher crude prices can also complicate the Reserve Bank of India’s policy decisions by making inflation management more difficult.
The crucial question for investors is whether the oil-price spike proves temporary or persists long enough to affect corporate earnings estimates.
US Bond Yields and Global Risk Aversion

Global financial conditions added another layer of uncertainty. US Treasury yields remained elevated, with the 10-year yield around the 5% level cited in market commentary.
When US government bonds offer relatively high yields, international investors may become less willing to take risks in emerging markets. Higher yields can also put pressure on equity valuations by increasing the return investors demand from stocks.
For Indian markets, the effect can be amplified when elevated US yields coincide with geopolitical tensions, expensive crude oil and currency weakness.
Investors are therefore assessing more than domestic earnings. They are also weighing the relative attractiveness of Indian equities against global alternatives.
The broader lesson is that even a company delivering strong quarterly results can face selling pressure when global conditions deteriorate.
FII vs DII: Domestic Buying Provides Support
Institutional flows reflected contrasting investment strategies during the week of October 19–23, 2026. FIIs were net sellers on the week, while DIIs continued to provide support through strong domestic buying.
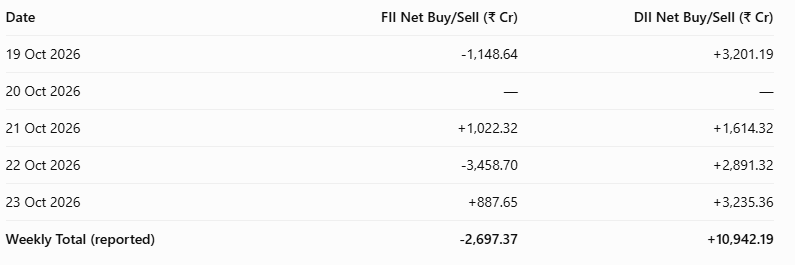
Source: Institutional activity data provided. October 20 figures were not available in the supplied table.
FIIs recorded net selling of ₹2,697.37 crore, with the heaviest outflow of ₹3,458.70 crore on October 22. In contrast, DIIs recorded net buying of ₹10,942.19 crore, including ₹3,235.36 crore on October 23 alone.
Domestic institutional buying helped cushion foreign selling. However, the sharp declines in mid-cap and small-cap stocks show that institutional support was not enough to prevent broader market weakness. Investors should watch whether FII selling eases, DII buying remains strong and market breadth improves in the coming sessions.
What to Watch Next Week
The coming week could bring fresh volatility as investors assess earnings announcements, crude oil movements, global bond yields and institutional flows.
Nifty 50: The 22,490-22,500 zone is an important near-term support area to monitor. A sustained break below it could expose lower levels around 22,350 and 21,965. On the upside, the 22,700-22,750 zone is an initial recovery hurdle, based on the technical levels provided.
Bank Nifty: The 53,900-54,000 area is a key support zone to watch. A breakdown could intensify selling pressure, while a recovery would need to be supported by improving banking-stock performance.
Q2 earnings: Results from banks, cement companies, technology businesses and other major firms could drive stock-specific movements. Investors should pay attention to profit margins, asset quality, demand trends and management guidance rather than focusing only on reported profit growth.
Crude oil and the rupee: Any further rise in oil prices or renewed currency weakness could keep investors cautious.
Volatility and broader markets: Stabilisation in mid-cap and small-cap stocks, along with an improvement in market breadth, would provide a more convincing sign of recovery than a rebound in the benchmark indices alone.
These levels are reference points, not guaranteed turning points. Market conditions can change quickly.
Lingo of the Week: Market Breadth
Market Breadth measures how many stocks are rising compared with those falling in a market session. It helps investors understand whether a rally or sell-off is broad-based or limited to a few stocks.
Why it matters: On October 23, 2026, 624 stocks advanced while 3,011 declined, highlighting widespread selling pressure across the market.
Key takeaway: Weak market breadth signals that selling is spread across multiple stocks and sectors, even if headline indices do not fully reflect the extent of the weakness.
Pocketful isn’t just another trading platform - we’re your partners on the journey to financial freedom.
Thank you for reading!
👀 Stay tuned. Stay diversified.
Until next time,
Team Pocketful.
Follow Us: Website
Download Our App: Available on Google Play & Apple App Store